

1.000,5).
Bar chart
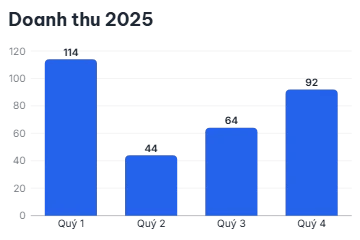
- Data: The table of categories (rows) and series behind the chart; edit cells or paste a table.
- Show values: A value label at each bar.
- Show legend: A legend of the series.
Horizontal bar chart
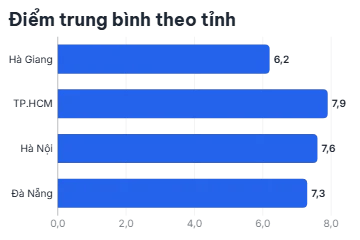
- Data: The table of categories (rows) and series behind the chart; edit cells or paste a table.
- Label side: Category labels to the left of the bars or inside them.
- Show values: A value label at the end of each bar.
Line chart
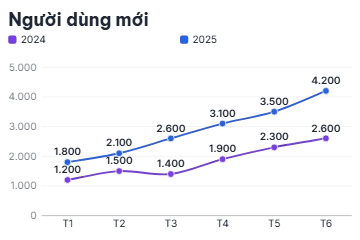
- Data: The table of categories (rows) and series behind the chart; edit cells or paste a table.
- Curve: Straight segments or a smooth curve through the points.
- Area: Fill under each line.
Pie chart
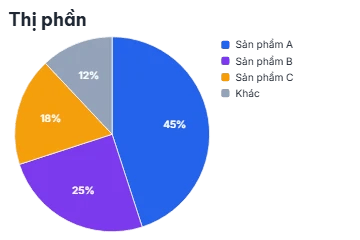
- Data: The table of categories (rows) and series behind the chart; edit cells or paste a table.
- Donut: Size of the hole as a share of the radius (0 = pie); a donut shows the total in the hole.
- Labels: Text on each slice.
Histogram
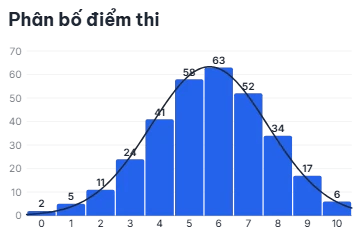
- Data: The bins as rows; the first series holds the counts.
- Curve: Bell curve: none, fitted to the bins, or from a mean and spread.
- Reference: A dashed vertical line at a value, with an optional label.
Waffle chart
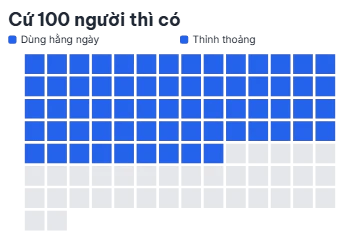
- Units: Units in the grid (1–1000).
- Groups: Highlighted groups (up to 6) that fill units in order; their counts add up to at most the number of units.
- Show legend: A legend of the groups.
Number counter
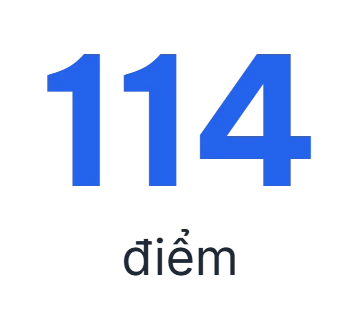
- From: Value the count starts at.
- To: Value the count ends at.
- Format: Number format: Vietnamese (
1.000,5) or English (1,000.5), decimals, prefix, suffix and short forms.
Progress
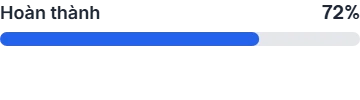
- Shape: A filling bar or a ring arc.
- Value: Filled percent (0–100).
- Label: Label text.
Vietnam map
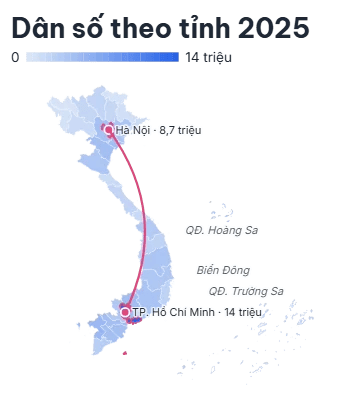
- Data: One row per province (names with or without diacritics, former provinces or codes); the first series holds the values.
- View: The whole country with the archipelagos, or a north, central or south crop.
- Arcs: Up to 4 flight paths that draw on at their cues, with a plane.
Bar chart race
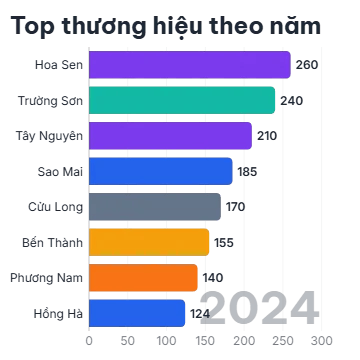
- Data: Rows are the entities (bar colour = row colour); each series is one period, named like “2019”.
- Top n: Bars shown: the top N entities of each period.
- Period seconds: Seconds between period steps.
Event timeline
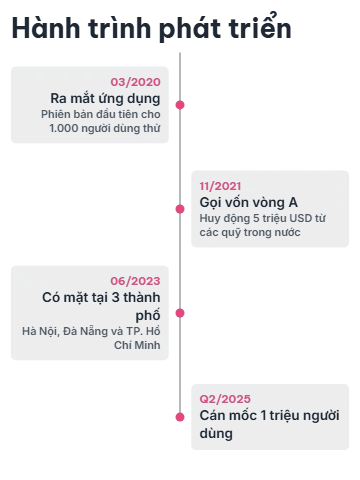
- Events: Dated events in order (up to 12); each appears at its own cue.
- Orientation: Vertical (for 9:16) or horizontal (for 16:9).
- Side: Cards alternate sides of a centred line, or all sit after a line along the edge.
VS comparison
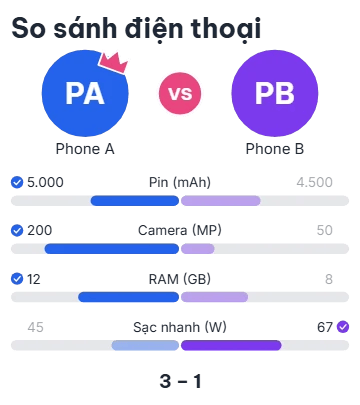
- Data: The two series are the sides; each row is one metric.
- Better: Whether the higher or the lower value wins a row; the winning side gets a check mark.
- Show tally: Rows won by each side (“3 – 1”) and a crown on the overall winner.
Gauge dial
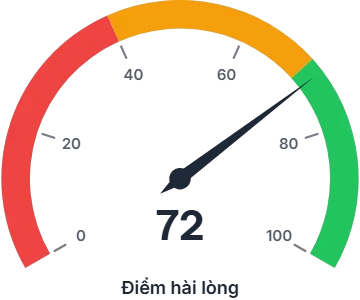
- Value: Value the needle sweeps to.
- Bands: Up to 5 coloured bands along the dial.
- Arc degrees: Dial sweep: 180 (semicircle), 240 or 270 degrees.